Solution · OT Sentinel
Visibility into the PI displays your business relies on
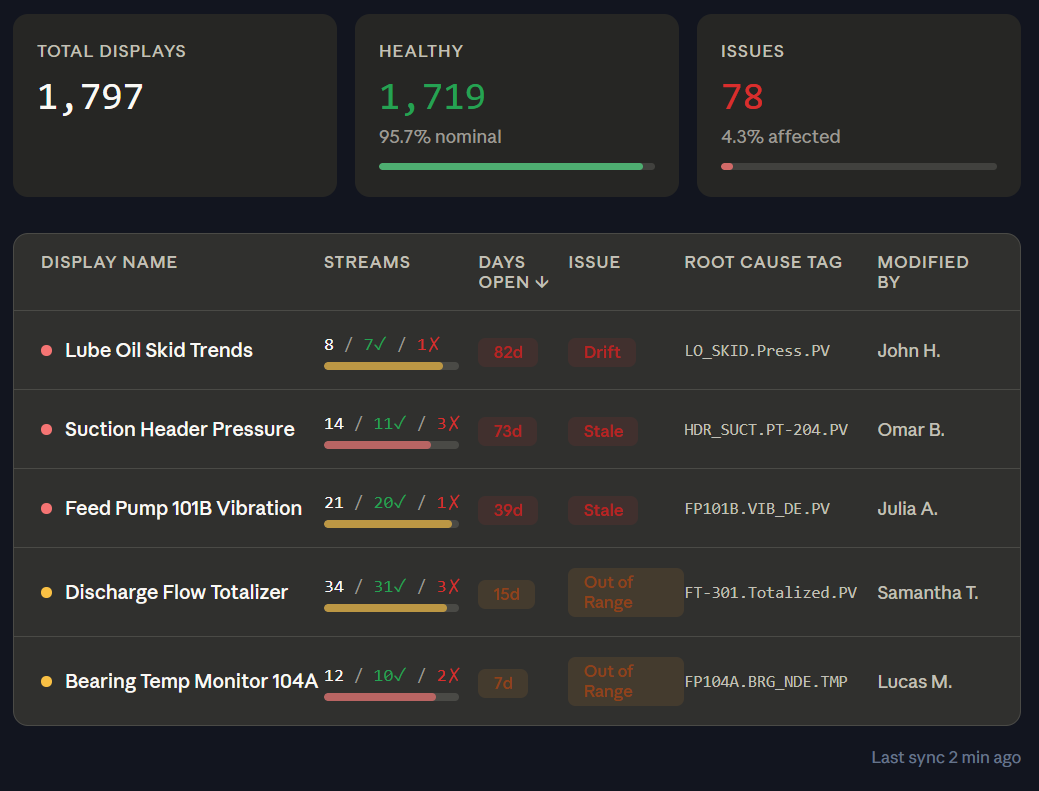
Start with selected PI Vision displays, then trace upstream to the PI tags, AF attributes, calculations, and configuration issues that may affect reliability, performance, and trust.